Version Gallery

General Status: NORMAL
LBL pixelKr project team at Bekeley

Progress are happening right now

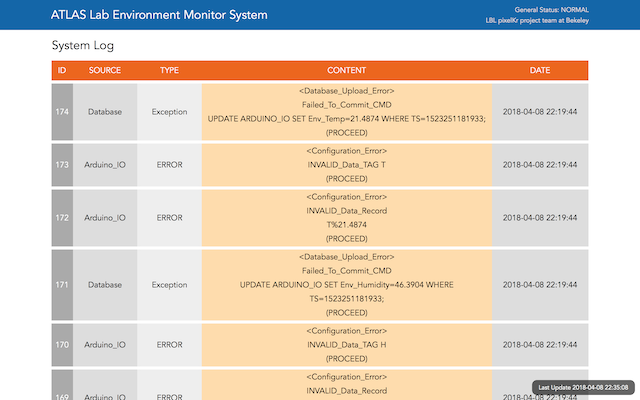
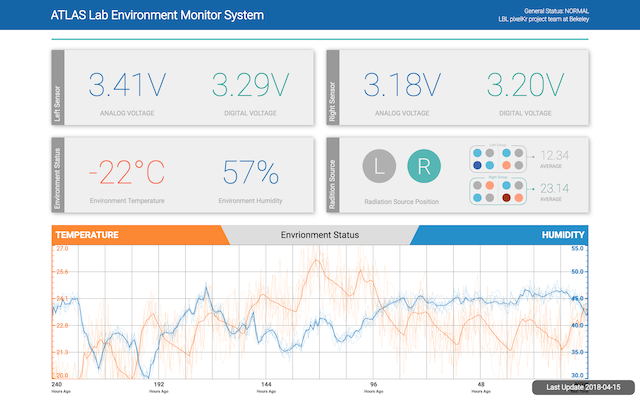
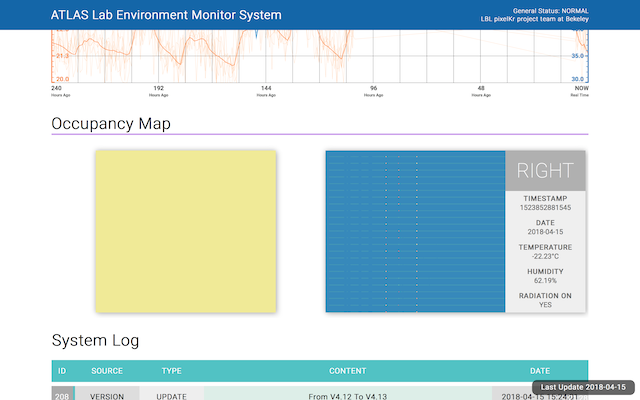
ATLAS Lab Environment Monitor System is a comprehensive automatic system that helps the LBL Atlas pixelKr team to keep an eye on the lab situation 7-24 hours. We need to know the environment and on-board situation when we expose the chip to the radiation source, and get ourselves ready to interpurate when something goes wrong. The blueprint of this system is shown as follows, and we are currently working on it, so updates may happen everyday.

SYSTEM BLUEPRINT

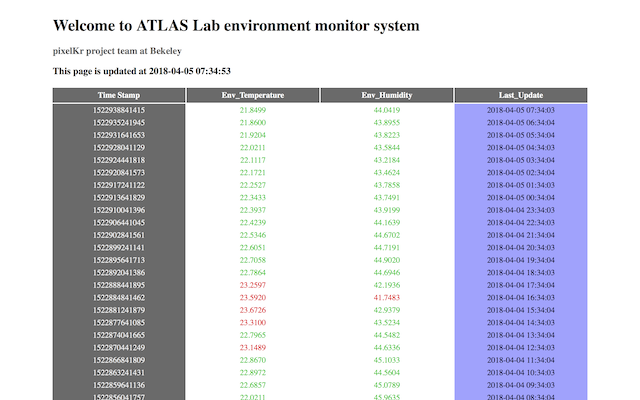
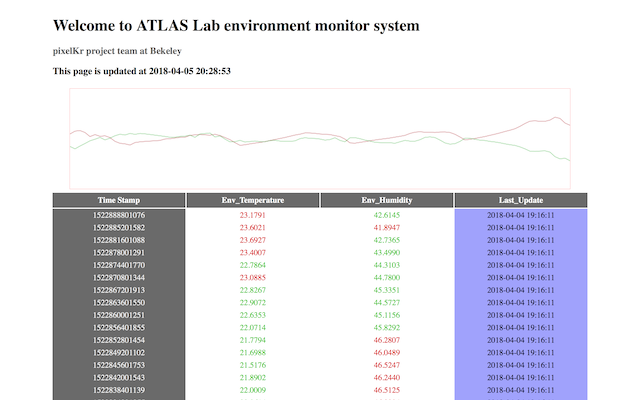
Pre-Versions of front-end development

Pre-versions are the versions that are not publicly available. However, it does not mean this part of development are easy. Actually, every simple feature are built by a lot of effort of the developer, which is why they are also included in this gallery.

PRE-Version 1

Pre-Version 1

This is the very first trial version of the monitor system web page.

In this version, I developed "Web Page Generator", using python, to replace the pre-defined data tags, which is written in the "raw" webpage, with the data from database. It serves like a simplified PHP server.

Starting up into a brand new field can always be tough. However, I made it through the most difficult period, and achieved my goal using courage and creativity.

Apr 04 - 2018

PRE-Version 2

Pre-Version 2

A Chart has been added to the webpage. Yet this chart is very simple, but by doing this I realized the unlimited potential of it. This is the begin of the "interactive revolution".

The first version of the chart has been set to display only 2 sets of data, not scalable, not draggable, no assistlins available. But it will change soon.

Apr 05 - 2018

PRE-Version 3

Pre-Version 3

The chart has been made scalable and movable, but instead pf directly dragging it, you can only scale the chart or move it by clicking the buttons or typing into the textboxes. This is exteremely inelegant, and will not last to long before I made up my decision to make a change.

Apr 06 - 2018

PRE-Version 4

Pre-Version 4

As you can see from the screen shot, I removed the ugly buttons between the chart and the table. Only 5 buttons ("<<","<","RESET",">",">>") are left.

This is because I made the chart more interactive than ever. By dragging it in different places, you can both move it or scale it. And this feature will be keeped in all future versions. You can even try it now at the home page!

Apr 07 - 2018

PRE-Version 5

Pre-Version 5

As soon as I have comlpeted the main structure of the data chart, I realized that the table of data, which lasts from the very first version, is no longer needed. By removing it, I can also make space for a brand new table -- the log table, with a brand new design.

As you can see from the screen shot, the log table tells you everything that happens in the lab, and it keeps itself up-to-date!

Apr 08 - 2018

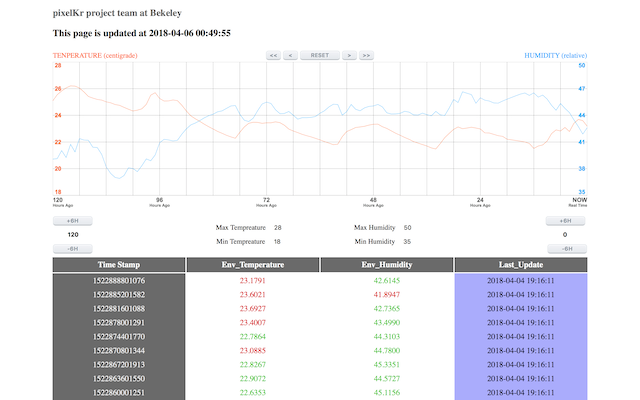
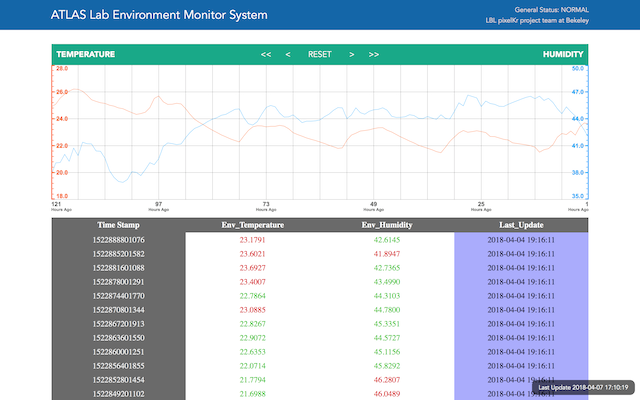
Release versions of the System

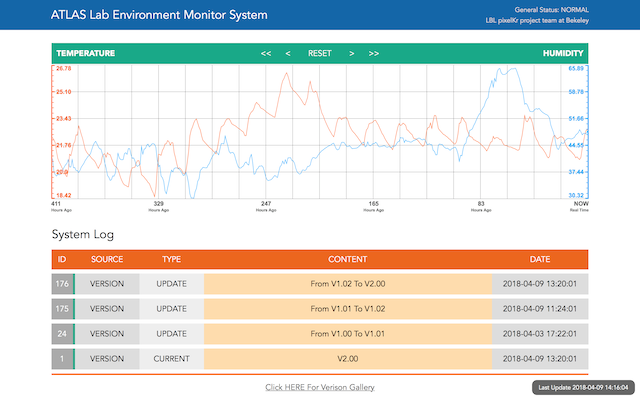
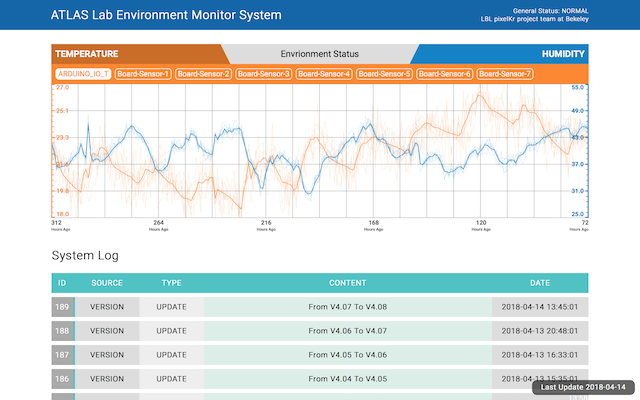
After serval important upgrades, I have made the entire system more complete than ever. Then comes this big decision: I will put it on my personal domain! Although it will be eventually moved to LBNL on-site server, I still want it to be easily shown to everyone, including the public, and share our pleasure of making every single progress.

Version 2.00

Version 2.00

The system is now "unoffically" available on the Internet, exciting! By using a private server and a self-purchased domain name, we made the world know what is happening in this project.

At the same time, we will keep upgrading this system to make it more and more powerful.

Apr 09 - 2018

Version 3.00

Version 3.00

There was no screen shot for this version, because the entire version 3 series looks the same as the previous version. However, dramatic changes have hppened in the inside. I restructured the entire "chart-generate" code to make it portable and easy to use. I am even planning to make this part of my work become an open-sourced API available for the entire internet society.

Apr 11 - 2018

Version 4.00

Version 4.X (Early)

Thanks to the changes made in V3.X, we now have a more flexable platform to add new features to the data chart. And you can now use this chart to show as much sets of data as you want, and switch the status of them.

To be specific, when the status if "show", you can see all the details of that data set, and if it is "half-show", you can see an fadded line with no additional information. which is helpful if you have a lot of sensors.

Apr 14 - 2018

Version 4.09

Version 4.09

As you can see from the screen shot, a new section has been added to the page. And now it is actually ready for the final run.

Apr 14 - 2018

Version 4.14

Version 4.14

Ocupancy Map has been made available along with detailed information.

An bug concerning timestamp has also been fixed in this version.

Apr 14 - 2018


By Yuxuan Zhang

APRIL 2018